|
by Paul Mayewski When we first realized that abrupt climate change was real we thought that these events only happened during ice ages. But then ice cores revealed that the collapse of many civilizations during the last 12,000 years were associated with smaller abrupt-onset changes in the global distribution of precipitation and the amount of sea ice. We wondered if any such events could be seen in the most recent hundred years or so (the “instrumental period”). When we looked, we found at least one: dramatic warming in the Arctic over the past decade, driven by increasing greenhouse gas concentrations. This rapid warming has led to an equally rapid melting of the vast majority of mountain glaciers on the planet, of most of the stabilizing, multi-year Arctic sea ice, and loss of some ice shelves and coastal ice in Antarctica. Because Arctic sea ice acts as a layer of insulation preventing the warmer ocean water from heating the cold Arctic air, and as a mirror preventing the sun from warming the water, its recent loss has led to accelerated warming of the Arctic’s air and water and made the region’s climate one of the fastest changing on the planet. In portions of the Arctic, the rate of change may be the fastest in the last 12,000 years making this event the first of several potential abrupt climate change events triggered by rising greenhouse gas levels. Because the Arctic is warmer than usual, it’s temperature is closer to that of the mid-latitudes resulting in a flattened temperature gradient. This gradient change creates major changes in precipitation patterns, including the current drought in the Western US and a general increase in extremes of temperature and storm strength. 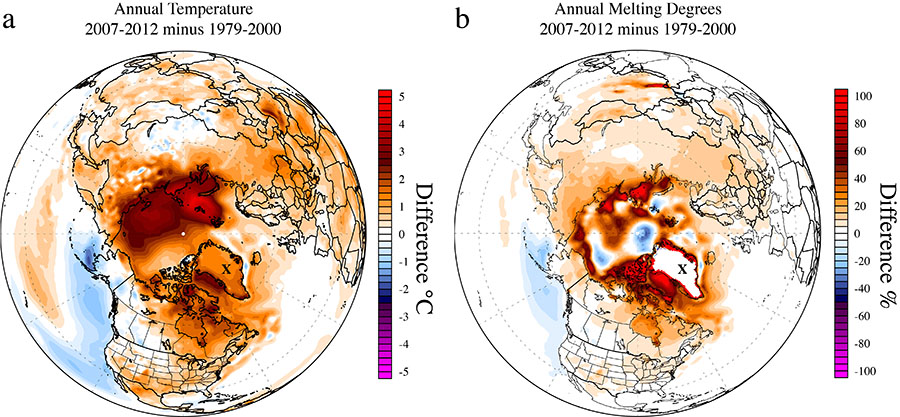 Change in average annual temperature at 2 meters above the ground (left) in °C, and in the percentage of annual melting degrees (right). The annual temperature diagram shows the rapid warming underway in the Arctic, and melting degrees (accumulated degrees above freezing) reveals the longer summers. Both diagrams compare the period 2007 to 2012 versus 1979 to 2000. Calculated from ECMWF ERA-Interim reanalysis monthly 2 meter air temperature data, plotted using Climate Change Institute Climate Reanalyzer™ software. Comments are closed.
|
 RSS Feed
Site powered by Weebly. Managed by pair Domains