|
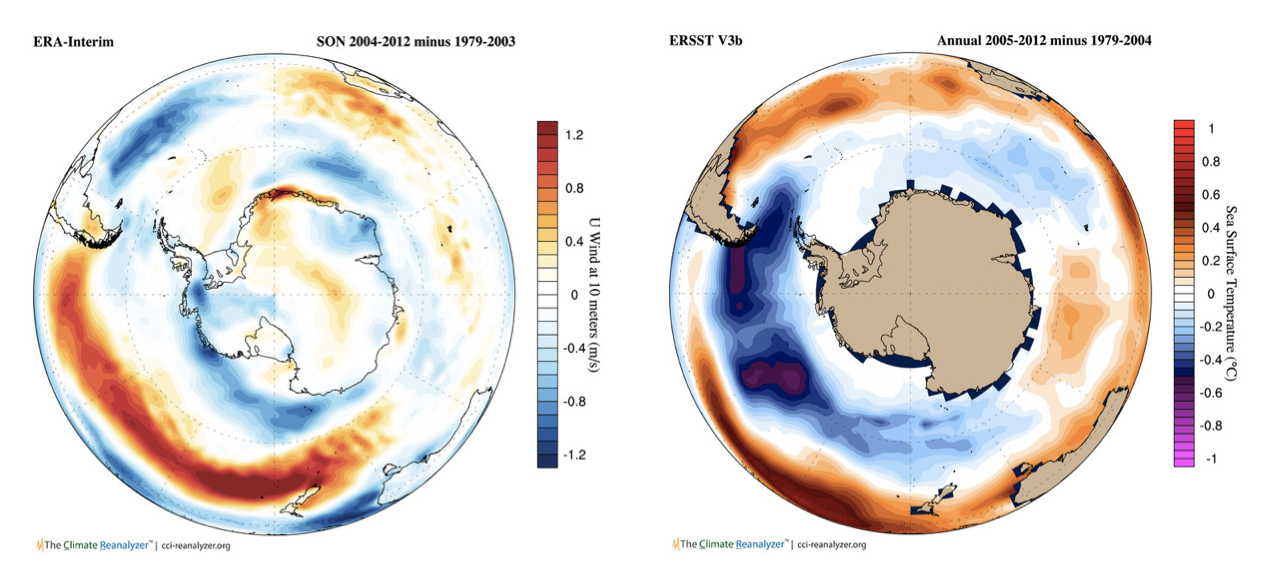
by Paul Mayewski CFC-caused, high-altitude ozone destruction occurs in both the Arctic and the Antarctic, but is much more pronounced in the Antarctic. In the Arctic, greenhouse gas warming is the main actor, but in the Antarctic, ozone loss adds a second protagonist, creating a double-whammy. Since ozone absorbs sunlight in the UV-B portion of the spectrum, it warms the atmosphere around it. Thus, with the modern reduced levels of high-altitude ozone in the Antarctic, parts of the stratosphere are much cooler than before. Combined with greenhouse-gas warming to the north, the result is stronger, more-poleward, Antarctic Westerlies—the Antarctic Polar Vortex. These stronger Westerlies, unparalleled for at least the last 5,200 years, combined with greenhouse gas warming, yield a constellation of effects that contrast with those in the Arctic. 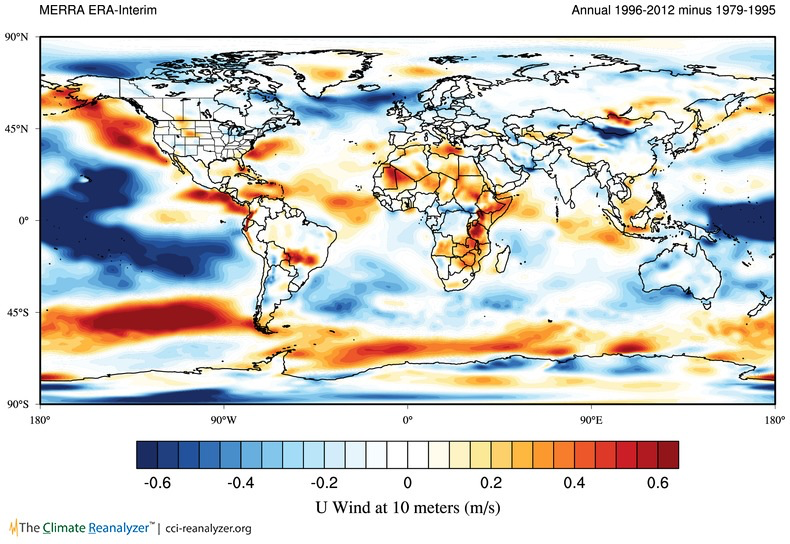 Changes in wind global speeds (U). This plot shows the difference in annual average wind speeds around the globe between the periods 1996 to 2012 and 1979 to 1995. The dark red area just north of most the Antarctic coast, represents a 10% increase in wind speed. Plotted using Climate Change Institute Climate Reanalyzer™ software. The stronger Antarctic Vortex means that the air inside it is colder than it would be if it was weaker. The colder air and stronger winds have resulted in increased amount of sea ice around much of the Antarctic coast line. The higher speeds of the Westerlies also brings more deep water to the surface, that is, more upwelling, which melts the ice shelves from their undersides. So, at the same time that we are observing record lows of Arctic sea ice, we see the record highs of coastal sea ice around Antarctica and record losses of Antarctic coastal ice shelves. 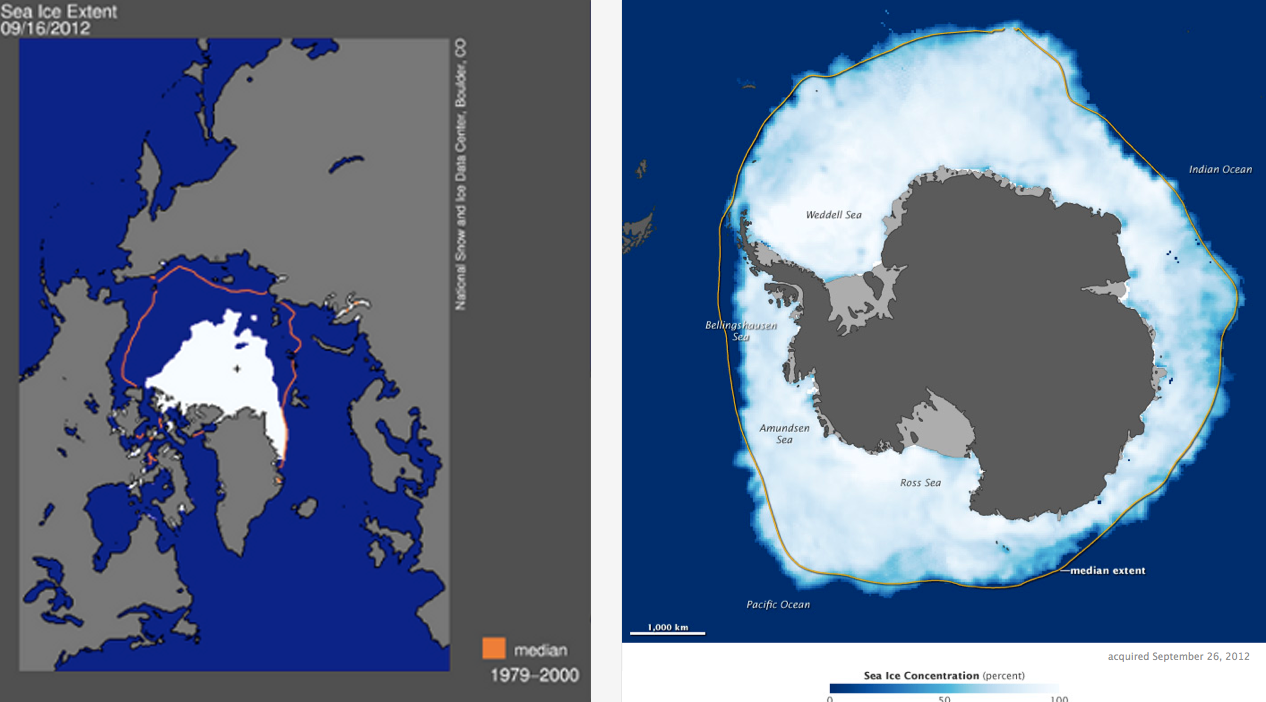 Record low Arctic sea ice and record high Antarctic sea ice. October 11, 2012 “Two weeks after a new satellite era record was set in the Arctic Ocean for the least amount of sea ice coverage the ice surrounding Antarctica reached its annual winter maximum—and set a satellite era record for a new high.” From the NASA Earth Observatory Just to the north of the westerlies, at the northern end of the Antarctic Peninsula, higher than usual temperatures occur due to greenhouse gas warming, just as they do in the Arctic, and record losses of both sea ice and ice shelves are being observed there. See the Antarctic Climate Change and the Environment report for research on Antarctic Westerlies and sea ice. The effects of ozone-loss-caused changes in Antarctic wind patterns also extend to Australia where they are causing droughts in some regions, and to New Zealand and southern South America where they are increasing snowfall on the western slopes and causing some of the glaciers there to advance. While the warmer-than-ice upwelling deep water is melting ice shelves, it is cooler than the greenhouse gas warmed air it meets at the ocean’s surface. Globally, this constant supply of cooler-than-air water at the surface, keeps the air temperatures of the southern hemisphere from increasing as much as those of the northern hemisphere, and keeps global average temperatures from rising as much as they would otherwise. Thus, ozone loss is masking the full effects of greenhouse gas warming just as industrial sulfate pollution did after the 1940s and before the Clean Air Act. 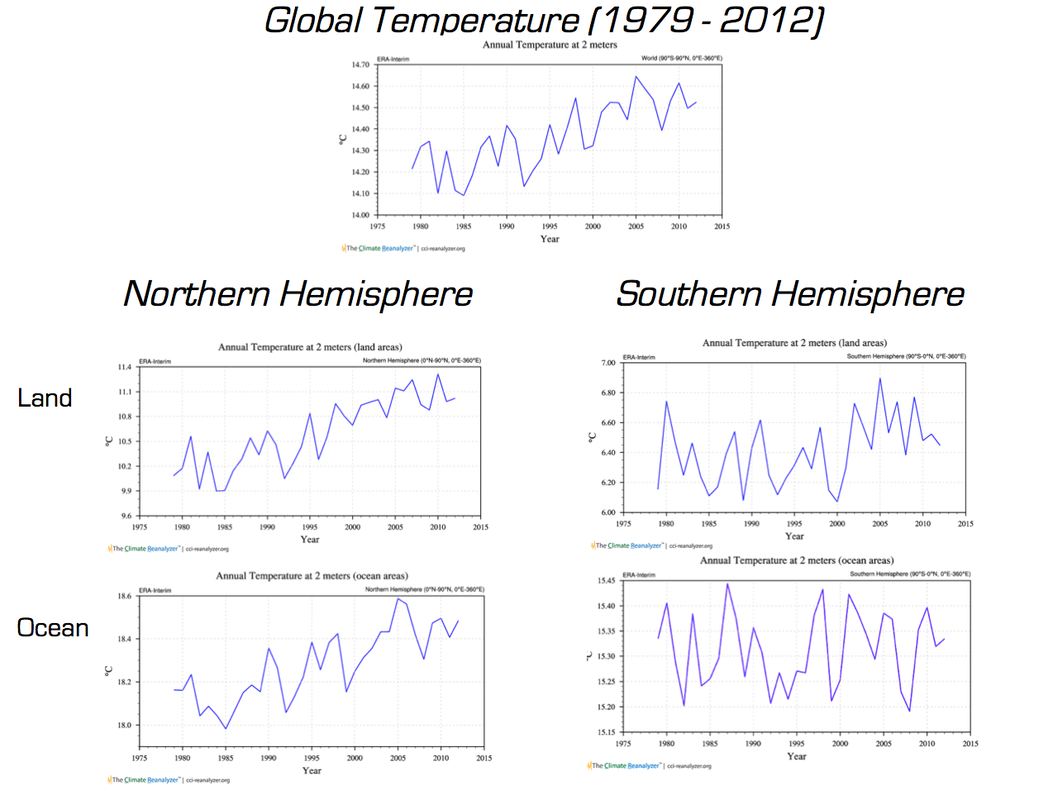 Greenhouse gas warming in the Northern and Southern Hemispheres. The Southern Hemisphere, dominated as it is by oceans, and now also by increased upwelling, does not show as much increase in air temperature as the Northern Hemisphere. The ozone-loss-caused upwelling is masking the global average rise due to greenhouse gases. Plotted using Climate Change Institute Climate Reanalyzer™ software. by Paul Mayewski When we first realized that abrupt climate change was real we thought that these events only happened during ice ages. But then ice cores revealed that the collapse of many civilizations during the last 12,000 years were associated with smaller abrupt-onset changes in the global distribution of precipitation and the amount of sea ice. We wondered if any such events could be seen in the most recent hundred years or so (the “instrumental period”). When we looked, we found at least one: dramatic warming in the Arctic over the past decade, driven by increasing greenhouse gas concentrations. This rapid warming has led to an equally rapid melting of the vast majority of mountain glaciers on the planet, of most of the stabilizing, multi-year Arctic sea ice, and loss of some ice shelves and coastal ice in Antarctica. Because Arctic sea ice acts as a layer of insulation preventing the warmer ocean water from heating the cold Arctic air, and as a mirror preventing the sun from warming the water, its recent loss has led to accelerated warming of the Arctic’s air and water and made the region’s climate one of the fastest changing on the planet. In portions of the Arctic, the rate of change may be the fastest in the last 12,000 years making this event the first of several potential abrupt climate change events triggered by rising greenhouse gas levels. Because the Arctic is warmer than usual, it’s temperature is closer to that of the mid-latitudes resulting in a flattened temperature gradient. This gradient change creates major changes in precipitation patterns, including the current drought in the Western US and a general increase in extremes of temperature and storm strength. 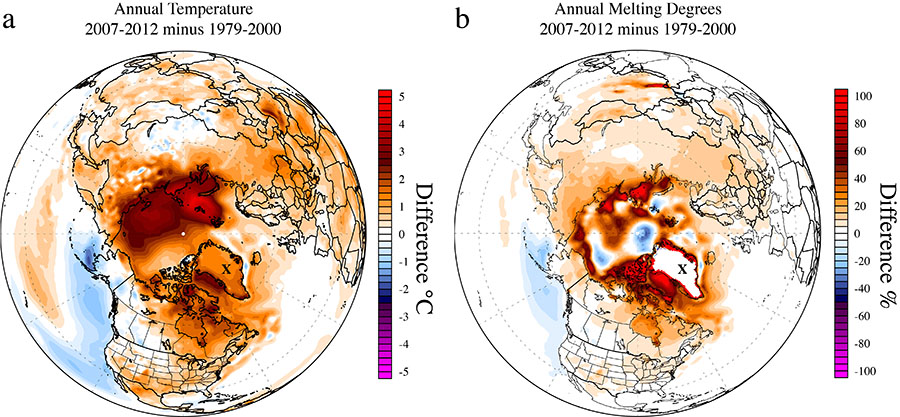 Change in average annual temperature at 2 meters above the ground (left) in °C, and in the percentage of annual melting degrees (right). The annual temperature diagram shows the rapid warming underway in the Arctic, and melting degrees (accumulated degrees above freezing) reveals the longer summers. Both diagrams compare the period 2007 to 2012 versus 1979 to 2000. Calculated from ECMWF ERA-Interim reanalysis monthly 2 meter air temperature data, plotted using Climate Change Institute Climate Reanalyzer™ software. by Paul Mayewski Global wind patterns are the primary means by which water vapor, heat, and pollutants move from place to place around the planet. We now know that the pathways and strength of these patterns can change rapidly, in a few months or years, and then remain in the new pattern for decades to millennia. When this has happened in the past, they have been proverbial “show-stoppers” for civilizations and ecosystems. We didn’t always know this. Back before the 1990s, when we discovered abrupt climate shifts in the GISP2 ice core from central Greenland, we thought the atmosphere was a slave to the ocean, impotently following its direction. The GISP2 discovery of these abrupt shifts radically changed our view of Earth’s climate and our role in it: from a slow-moving hulk taking thousands of years to make meaningful change, to a manic jack-rabbit, that can respond rapidly to changes like the current dramatic rise in greenhouse gases and CFC-caused destruction of high-altitude ozone. GISP2 profoundly changed our thinking—we discovered that large-scale climate changes could happen in less than a political cycle or a human childhood—and that the ocean wasn’t driving these changes: it was the atmosphere. 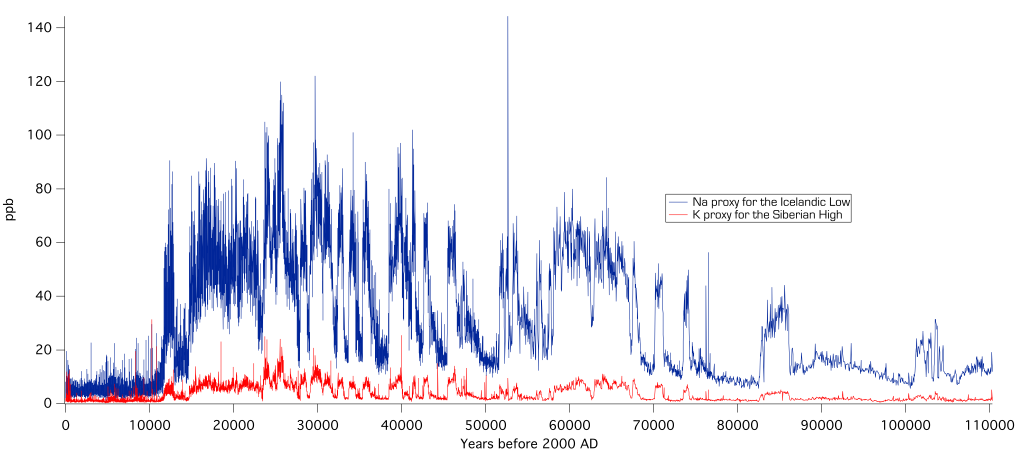 Radical and rapid changes in climate and global wind patterns discovered in the GISP2 ice core. The original GISP2 chemistry data was used to understand the behavior of atmospheric circulation over the past 110,000 years, (see here and here) and revealed abrupt changes in the intensity of major atmospheric circulation patterns. Generally, higher sodium, Na, is associated with deeper Icelandic Lows, and higher potassium, K, is associated with stronger Siberian highs; both part of the modern winter pattern Today, there are distinct summer and winter wind patterns for the Arctic. In the winter, there are pronounced low-pressure systems over the North Pacific and in the North Atlantic over southern Greenland and Iceland (Icelandic Low), and a high-pressure system over Siberia (Siberian High). In the summer, these low pressure systems are much reduced, and the Siberian high is replaced with a low pressure system. The Arctic Westerlies are typically much stronger during the winter pattern. One of the things we discovered in the Greenland ice cores (see here and here) is that the length of these seasonal patterns could suddenly increase or decrease by several weeks to a month or more, with the new pattern persisting for decades to thousands of years. We found that in some cases these transitions could occur in as little as one or two years. 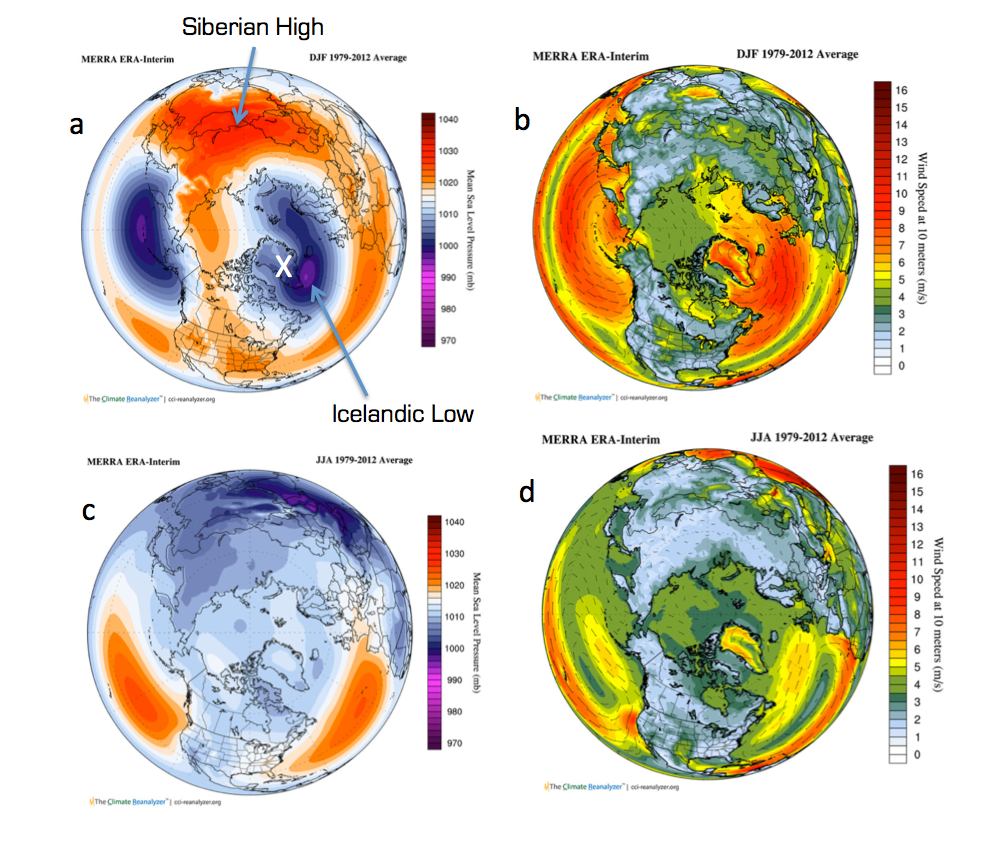 Northern Hemisphere wind patterns during winter (top row, DJF for Dec-Jan-Feb) and summer (bottom row, JJA for Jun-Jul-Aug). The left column shows the winter and summer average surface pressures for the period 1979 to 2012, and the right column shows the associated, average wind patterns. For the pressure diagrams, blue colors show low pressure and orange shows high pressure. For the wind diagrams, red show faster winds, green shows slower, and blue slowest. The white “X” marks the location of the GISP2 ice core. Combined ERA and MERRA climate reanalysis data, plotted using Climate Change Institute Climate Reanalyzer™ software. Many of us are familiar with seasonal changes in weather patterns where we live. The weather patterns at our homes are local reflections of these larger patterns. Just imagine then, if suddenly, let’s say over the last few years, there was a shift toward a longer summer pattern–the transport of moisture, heat, and pollutants would be very different in some regions. An example came during the 2013–2014 winter when drought dominated the US West and cold stormy conditions dominated the US East.
|
 RSS Feed